SPC Calculations and Definitions
SPC, or Statistical Process Control, is a methodology used to monitor and control processes to ensure they operate efficiently and produce quality output. Process variations in SPC refer to the fluctuations or deviations in a process's output over time. The following are some key definitions and calculations related to SPC process variations:
Mean (Average)
Definition: The central tendency of a set of data points.
Calculation: The sum of all data points divided by the number of data points.
Symbol: X̅
Range
Definition: The difference between the highest and lowest values in a data set.
Calculation: Maximum value - Minimum value
Symbol: R
Standard Deviation
Definition: A measure of the dispersion or spread of a set of data points.
Calculation: Square root of the variance.
Symbol: σ (sigma)
Sample Size
For X-Bar: 5
For I-MR: 1
Process Variation
Definition: The range of fluctuation or dispersion observed in a process.
Calculation: Often measured using the standard deviation or range.
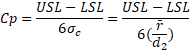
Cp
Cp is a capability index. It compares the process cability to the maximum allowable variation as indicated by the tolerance. This index provides a measure of how well the process will satisfy the variability requirements.
Cpk
Cpk is a capability index. For bilateral tolerances, Cpk will always be less than or equal to Cp.
![]()
Cpk will only be equal to Cp if the process is centered.
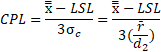
Cpk is calculated as the minimum of CPU or CPL where:
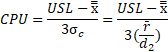
and
Pp
Pp is a performance index. It compares the process performance to the maximum allowable variation as indicated by the tolerance. This index provides a measue of how well the process will satisfy the variability requirements.
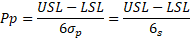
Pp is not affected by the process location.
Ppk
Ppk is a performance index. It takes process location as well as the performance into account. For bilateral tolerances, Ppk will always be less than or equal to Pp.

Ppk will only be equal to Pp if the process is centered.
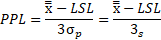
Ppk is calculated as the minimum of PPU or PPL where:
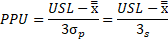
and
Control Limits
Definition: The boundaries within which a process is expected to operate.
Calculation: Typically derived from historical data or statistical formulas.
For X-Bar: N=5, d2=5
For I-MR: N=1, d2=2
For UCL and LCL, LinePulse uses the following:
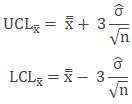
 'n' in the above formula represents the subgroup size.
D2 Constant Table
LinePulse uses the following D2 constant table for estimating population sigma:
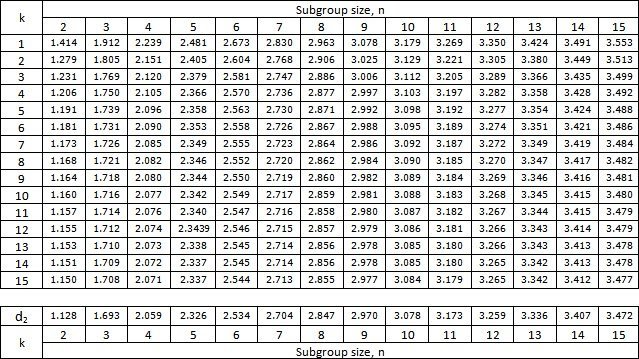
Chart Reference Colors
Mean: Green
Control Limits: Dashed red
Spec Limits: Solid red
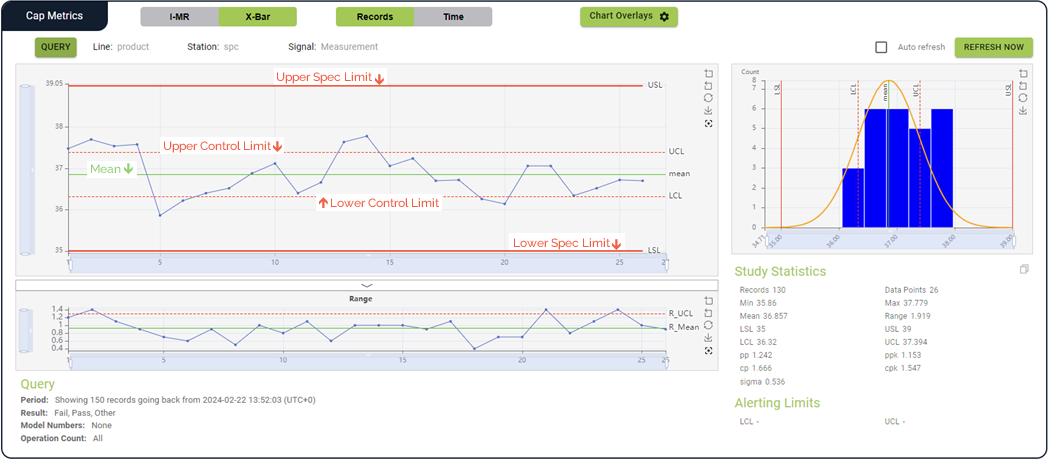
Sample SPC graph
Last modified: March 26, 2024