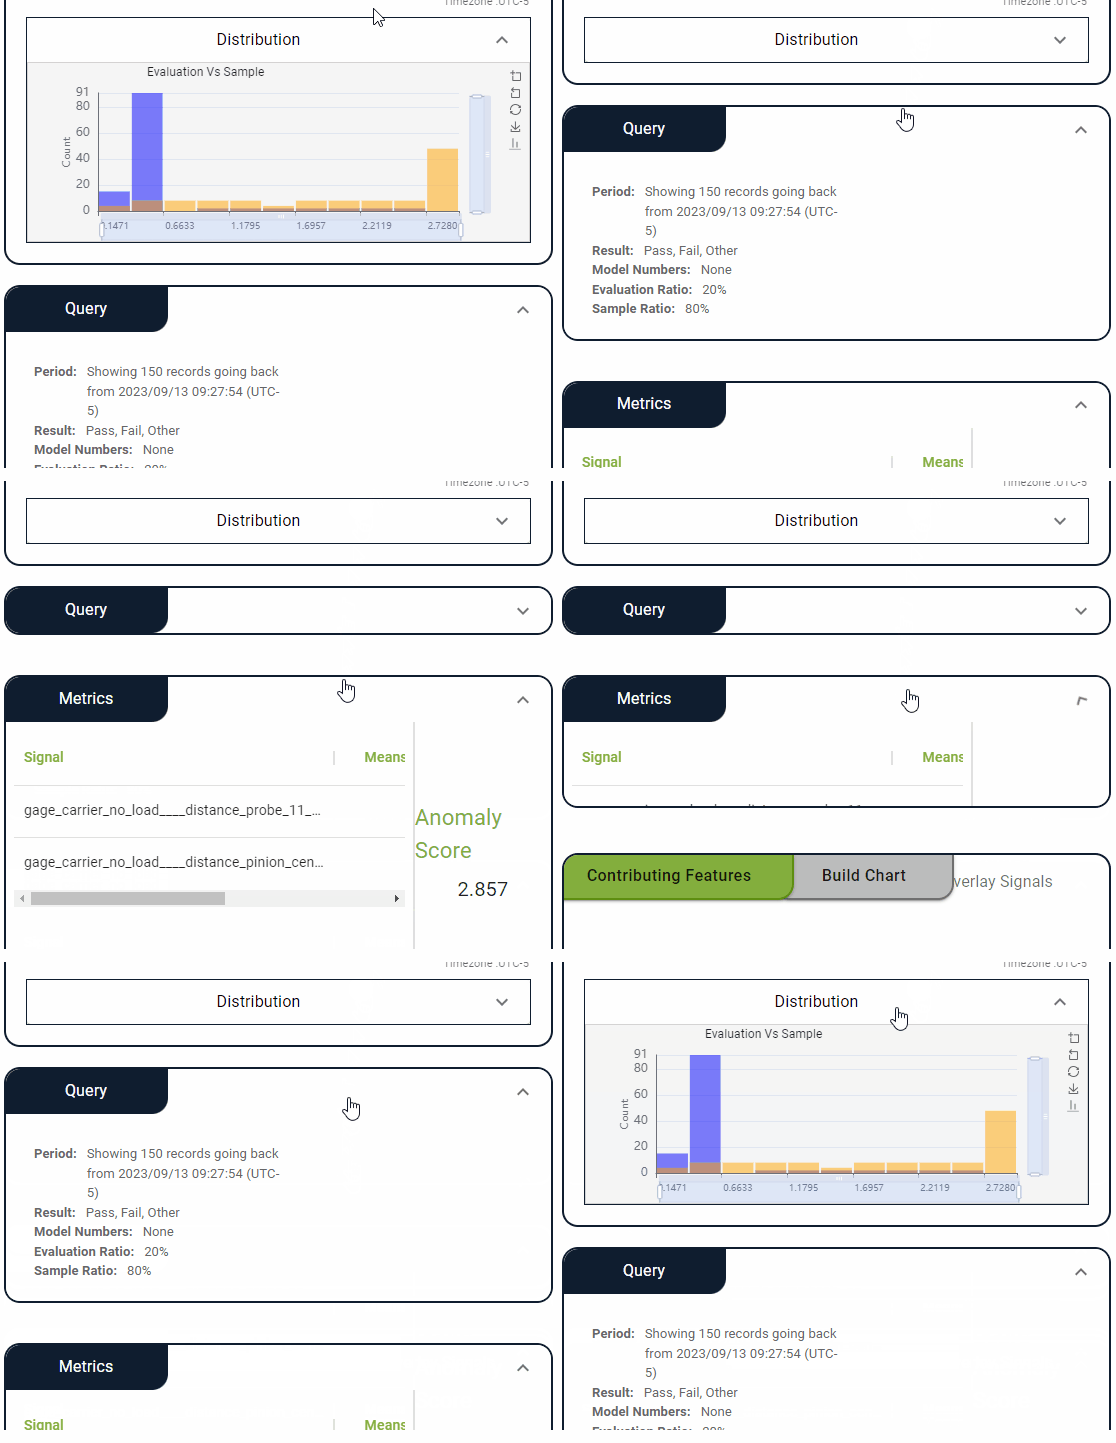
Working with Charts
Charts provide a detailed view of your data in LinePulse, allowing you to easily detect anomalies and trends. You have the ability to adjust the displayed range, save a snapshot of the chart as a bitmap image and more.
Adjusting how Charts Display Data
To zoom in on a chart

Click  (Zoom).
The cursor changes to a '+'.
Click and drag the portion of the chart you wish to expand.
LinePulse redraws the chart to reflect your selection.
![]() Click
Click  (Zoom Reset) to restore the default zoom.
To adjust a chart's x-axis

Click and drag the x-axis handles to the desired position.
LinePulse redraws the chart to reflect your selection.
![]() Click and drag the blue bar to travel along the x-axis.
Click and drag the blue bar to travel along the x-axis.
![]() Click
Click  (Restore) to restore the default view.
To stack or unstack a bar chart

Click  .
.
LinePulse redraws the chart to reflect your selection.
Saving a Chart Snapshot
To download a chart as a bitmap image
Click  (Save as Image).
LinePulse saves a snapshot of the chart's current state as a .PNG file in your web browser's default download folder.
Collapsing and Expanding Tables/Charts
You can collapse or expand certain tables or charts by clicking their header. Look for the ▲ or ▼ symbols to see where this feature is available.

Last modified: July 05, 2024