Alerts | Overview
About the Overview Module
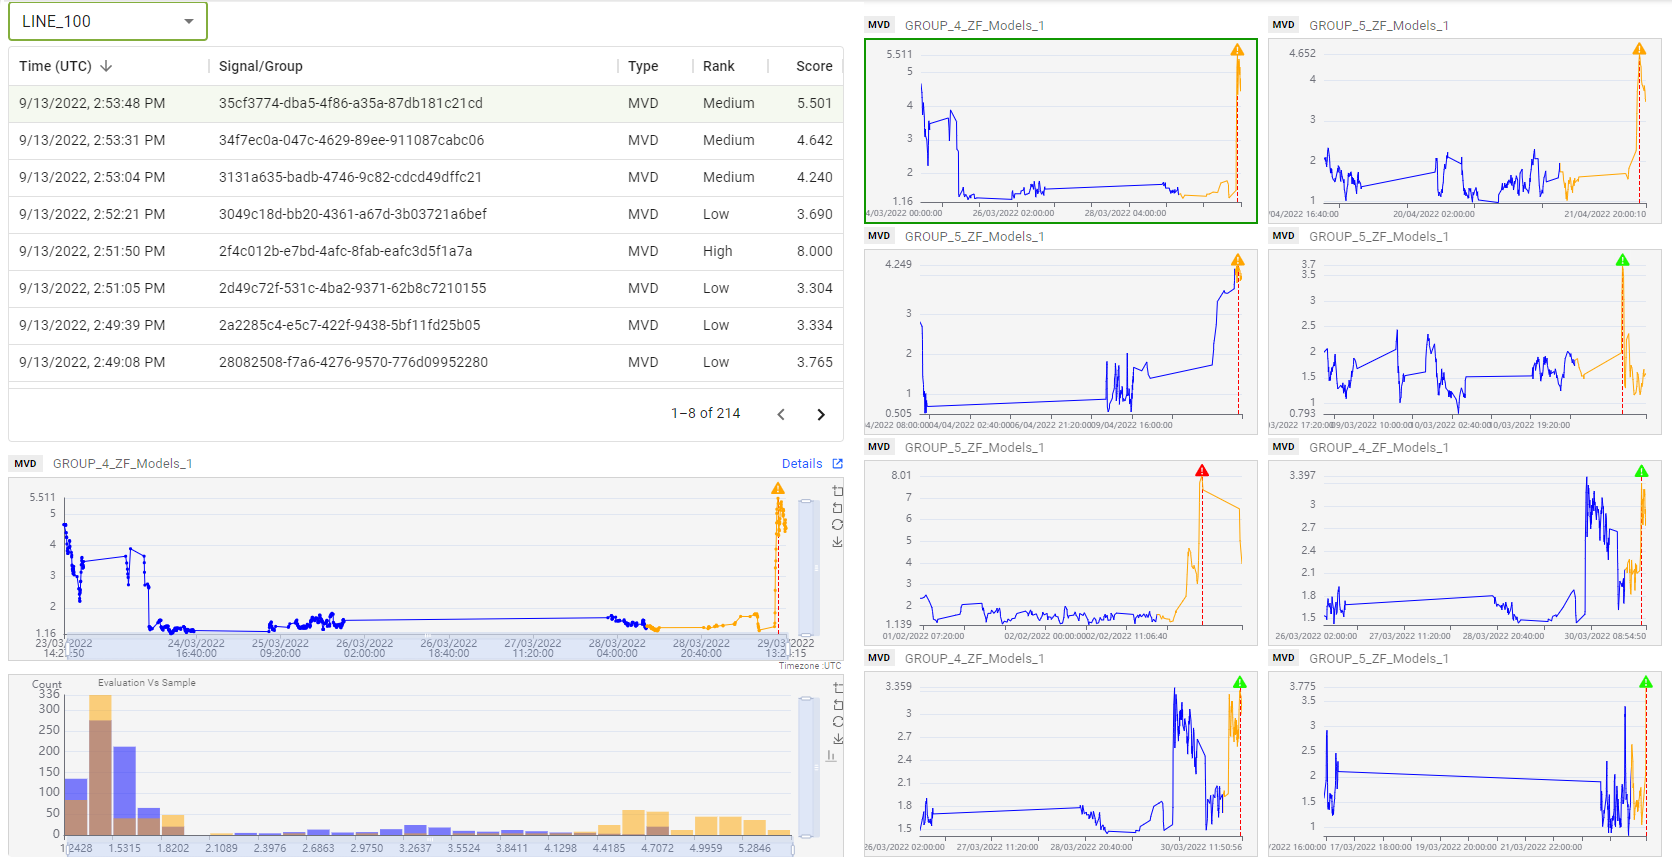
As the name suggests, you can use this module to view a real-time overview of any line. The Overview module provides constantly updating data on a number of signals simultaneously.
 To learn more about the Overview module, launch the corresponding tour from the Guided Tours menu in the LinePulse Resource Center.
Interactive Screenshot
Click any section for more information.
Launching the Overview Module
To launch the Overview module
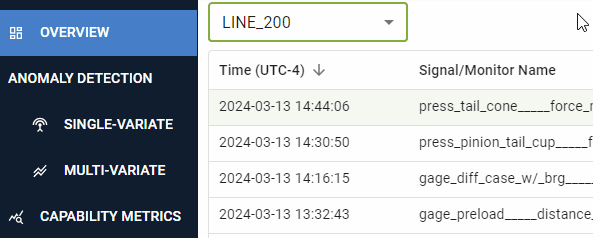
From the Navigation menu, click Overview.
LinePulse displays the Overview module.
Using the Overview Module
To change the line
Click Overview.
LinePulse displays the Overview module.
Select a line from the line selection menu.
LinePulse updates the Signal/Group table to match your selection.
To select a signal/group
See Working with Tables for tips on sorting, filtering and resizing LinePulse tables.
Click Overview.
LinePulse displays the Overview module.
Select a signal/group from the Signal/Group table.
If necessary, use the arrow buttons to scroll left or right to view more entries.
LinePulse displays the selected signal/group in the Detailed View section.
Alternatively, you could also select one of the small graphs, which correspond to the signals/groups currently displayed in the Signal/Group table.
To view further information about a specific data point in the Detailed View, hover your mouse cursor over that data point.
To open a signal/group in a new tab
In the large Detail View graph, click Details.
LinePulse opens the selected signal/group in the appropriate module, in a new browser tab.
Last modified: September 17, 2024