Anomaly Detection | Multi-Variate
About the Multi-Variate Module
Anomaly Detection lets you monitor your manufacturing processes for Anomalies by looking at changes in population distribution of an evaluation set and sample set. It consists of two modules: Single-Variate Detection (SVD) and Multi-Variate Detection (MVD). The Multi-Variate module allows you to group signals together to monitor the changing relationships between them.
 To learn more about the Multi-Variate module, launch the corresponding tour from the Guided Tours menu in the LinePulse Resource Center.
Launching the Multi-Variate Module
To launch the Multi-Variate module
From the Navigation menu, click Multi-Variate.
LinePulse displays the Multi-Variate module.
Working with MVD Queries
To create or modify an MVD query
From the Navigation menu, click Multi-Variate.
LinePulse displays the Multi-Variate module.
Click Query.
LinePulse displays the MVD Query Builder screen.
(Optional) Select a Line.
(Optional) Enter a Search term.
As you type, the signal treeview will update to reflect only those values that match your search terms.
You do not have to type the entire signal name. By entering a Search term that includes any portion of the desired signal, you instruct LinePulse to only display those signals that contain the term in the signal treeview, which makes it easier for you to select a specific signal in the next step.
(Optional) Click FILTER to restrict which signals appear in the query tree.
See Working with Query Filters for more information.
Select a signal from the treeview.
LinePulse adds the selected signal to the Selected Items list.
LinePulse enables both the Filters tab and the NEXT button.
If you wish to remove a signal from the Selected Items list, click the  button to the right of the entry.
Select additional signals from the treeview.
A minimum of two signals are required to perform Multi-Variate Analysis.
 All of the selected signals must belong to the same Line. If you select a different Line, LinePulse will remove all previously selected signals from the Selected Items list.
Click NEXT.
LinePulse displays the Filters screen.
Modify the MVD query filter or click FETCH RESULTS to accept the default MVD query filter values.
To modify your query, repeat the steps above. LinePulse will remember your previously entered query information until you log out.
To modify an MVD query filter
Create or modify an MVD query.
From the MVD Query Builder screen, click FILTERS.
LinePulse displays the Filters tab.
Select a Period | Start type.
LinePulse enters a suggested value (start time, minutes elapsed or number of records) corresponding to the selected Start type. You can accept this value or modify it now.
Select a Period | End value.
LinePulse enters a suggested value (end time, minutes elapsed or number of records) corresponding to the selected End type. You can accept this value or modify it now.
Based on the selected filters, LinePulse will indicate whether or not your query is MVD monitor-compatible.
Depending on the Start type you have selected, not all End types may be available.
Enter a Training Split or click and drag the slider to adjust the ratio between Sample and Evaluation.
Minimum and Maximum values may apply.
To restore Training Split to its default values, click DEFAULT.
(Optional) Select one or more Model Numbers.
(Optional) Select one or more Results.
(Optional) To filter by one or more Attribute, see To include attributes in an MVD query.
Click FETCH RESULTS.
LinePulse closes the MVD Query Builder screen.
To include attributes in an MVD query filter
From the MVD Query Builder | Filters tab, click + ADD ATTRIBUTES FILTER.
See To modify an MVD query filter for more information.
LinePulse adds a new attributes filter line.
Select an Attribute.
Select a Value.
To add additional attribute filters, click + ADD ATTRIBUTES FILTER, as required.
To delete an attribute filter entry, click the corresponding button.
Click FETCH RESULTS.
LinePulse closes the MVD Query Builder screen.
Understanding Metrics
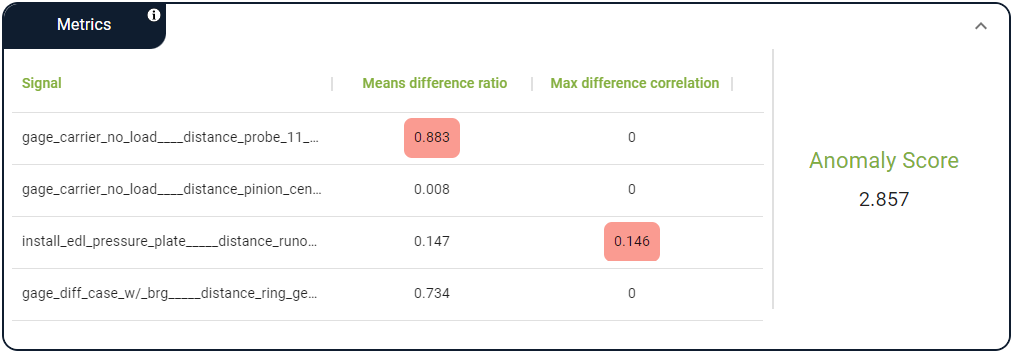
The MVD Metrics section displays two different anomaly calculations for each signal, as well as an overall Anomaly Score for the query:
The Means difference ratio is an indicator of signal variance between the training and evaluation periods. The higher the ratio, the larger the change in distribution. Greater change between training and evaluation is the first indicator that a particular signal was the cause of a high Anomaly Score.
The Max difference correlation calculates the correlation between the training period and the test period of each signal. This indicates if a signal is acting abnormally, rather than if it has shifted in distribution. Typically, scores greater than 1.0 indicate a signal that has influenced a high Anomaly Score. A score below 1.0 will not likely be responsible.
LinePulse highlights both the highest Means difference ratio and Max difference correlation values from the current query in the Metrics table. If two or more of these values are equal, LinePulse will highlight each of them.
The Anomaly Score indicates the level of variation between the selected training and evaluation samples—the greater the change, the higher the score.
Hover your cursor over the Anomaly Score to view it in greater precision.
Working with Contributing Features
Use the Overlay Signals and Anomaly Score toggles to visually compare and identify which signals have changed in behavior when compared to each other and the calculated Anomaly Score.
Demonstration of Contributing Features chart
See Working with Charts for tips on sorting, filtering and resizing LinePulse charts.
You can collapse one or more signal charts to make it easier to view specific charts. See Collapsing and Expanding Tables/Charts for more information.
Hide or display individual signals by clicking on the corresponding signal label.
Show/hide signals
Hover your mouse cursor over any record on the chart to view details for that record.
To view all contributing features in a single chart
From the Navigation menu, click Multi-Variate.
LinePulse displays the Multi-Variate module.
(If necessary) Create an MVD query.
(If necessary) Click the Contributing Features tab.
Click Overlay Signals to enable this functionality.
LinePulse displays all contributing features on a single chart.
With Overlay Signals enabled, you can select either a Normalized or Common y-axis.
You can restore the default view of one chart per signal by disabling Overlay Signals.
To show/hide the anomaly score from all contributing features charts
From the Navigation menu, click Multi-Variate.
LinePulse displays the Multi-Variate module.
(If necessary) Create an MVD query.
(If necessary) Click the Contributing Features tab.
Click Anomaly Score to enable or disable the anomaly score.
LinePulse displays or hides the anomaly score values from the Contributing Features charts. This applies whether or not Overlay Signals has been enabled as per the previous task.
Using the Build Chart
The Build Chart allows you to view the path each individual part takes through each contributing signal. This allows you to quickly compare training and evaluation data sets, as well as select a specific range for each signal.

Demonstration of Build Chart features
To select a range by signal
From the Navigation menu, click Multi-Variate.
LinePulse displays the Multi-Variate module.
(If necessary) Create an MVD query.
(If necessary) Click the Build Chart tab.
Click and drag along a signal axis to select the values you wish to include.
LinePulse redraws the chart to match your selection
Repeat the previous step along additional signal axes, as required.
To show/hide data points in the Build Chart
From the Navigation menu, click Multi-Variate.
LinePulse displays the Multi-Variate module.
(If necessary) Create an MVD query.
(If necessary) Click the Build Chart tab.
(Optional) Click TRAINING to enable or disable display of the training samples.
LinePulse displays or hides the training sample values from the Build Chart and dims the TRAINING button.
(Optional) Click EVAL to enable or disable display of the evaluation samples.
LinePulse displays or hides the evaluation sample values from the Build Chart and dims the EVAL button.
To reset the Build Chart
While viewing the Build Chart, click  .
.
LinePulse resets the Build Chart.
Working with MVD Monitors
To create an MVD monitor
From the Navigation menu, click Multi-Variate.
LinePulse displays the Multi-Variate module.
Only those MVD queries that are based on the number of Records being returned can be used to create an MVD monitor. Queries based on either Duration or Time are not eligible. LinePulse will notify you whether a filter is compatible or not with MVD monitor creation.
Click Create MVD Monitor.
LinePulse displays the MVD Monitor screen.
(Optional) Enter a Monitor Name.
LinePulse suggests a default name; however, you are free to override the suggestion. You can restore this default name at any time by clicking DEFAULT.
Enter a Frequency.
There is a minimum value for Frequency—if you enter a number lower than that value, LinePulse will replace it with the minimum value.
Select an Alert Threshold.
The possible values are Low, Medium and High.
(Optional) Enter Notes.
You can enter up to 600 characters in the Notes field.
(Optional) Select Deploy upon creation.
By default, LinePulse will deploy your monitor immediately. If you do not wish to deploy your monitor at this time, be sure to deselect Deploy upon creation.
Click Create.
LinePulse closes the MVD Monitor screen. If you have selected Deploy upon creation in the previous step, LinePulse will run the monitor now.
To view, edit, activate/deactivate or delete an MVD monitor
Administrators can view, edit, activate/deactivate or delete MVD monitors via System Settings | Anomaly Monitors.
Last modified: July 25, 2024